


Eurostat: “Inflation in the euro area“, Data from September 2014.
The data in this article show the most recent annual rates of change for the euro area headline inflation and its main components issued by Eurostat. The figures presented are early estimates of euro area inflation.
Main statistical findings
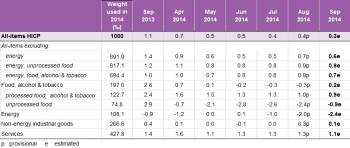
Euro area annual inflation is expected to be 0.3% in September 2014, down from 0.4% in August.
Looking at the main components of euro area inflation, services is expected to have the highest annual rate in September (1.1%, compared with 1.3% in August), followed by food, alcohol & tobacco (0.2%, compared with -0.3% in August), non-energy industrial goods (0.1%, compared with 0.3% in August), and energy (-2.4%, compared with -2.0% in August).
Flash estimate and full HICP data
The euro area inflation flash estimate is issued at the end of each reference month or shortly after. When the complete set of harmonised indices of consumer prices (HICP) is released around the middle of each month following the reference month, estimated data are replaced by actual data derived from the Member States figures. Further information on the accuracy of the flash estimates can be found in the article ‘Inflation – methodology of the euro area flash estimate‘.
Main components of inflation
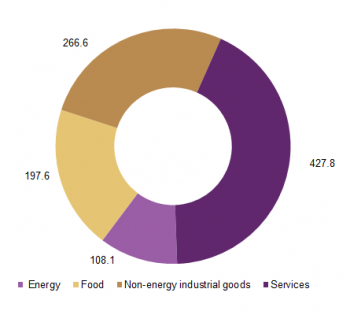
Each of the main components contributes in varying degree to the headline inflation in the euro area. In terms of weight, set at 1000 for the all-items HICP, services is the largest component, accounting for around 42.8% of individual consumption expenditure in the euro area. It is followed by non-energy industrial goods with around 26.7%.
Food, alcohol & tobacco and energy account for 19.8% and 10.8%, respectively. Together, they comprise less than one third of euro area expenditure, but they can have significant impacts on the headline inflation as their levels tend to fluctuate significantly more than the other components.
The main components and their relative weights for 2014 are presented in Figure 3 and Table 2, respectively.
The breakdown of the HICP into four main components does not follow the standard COICOP classification, but groups items from different expenditure classes into four broad product categories. For further details on the composition/sub-indices, please see Eurostat’s COICOP/HICP classification.