

Eurostat Statistics Explained: Industry and construction statistics – short-term indicators, 26 Νοεμβρίου.
Data from October 2014. Most recent data: Further Eurostat information, Main tables and Database. Planned article update: July 2015.
This article examines recent statistics in relation to developments for both industry and construction in the European Union (EU). Short-term business statistics (STS) are provided in the form of indices that allow the most rapid assessment of the economic climate within industry and construction, providing a first evaluation of recent developments for a range of activities. STS show developments over time, and so may be used to calculate rates of change, typically showing comparisons with the month or quarter before, or the same period of the previous year. As such, STS do not provide information on the level of activity, such as the monetary value of output (value added or turnover), or actual prices.
MAIN STATISTICAL FINDINGS
Industry
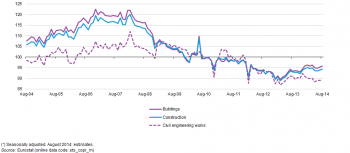
The impact of the global financial and economic crisis on the EU-28’s industrial economy and the muted recovery can be clearly seen in two of the main industrial indicators, namely the industrial production index and the index for industrial domestic output prices. Over several years there was relatively stable output and price growth across the EU-28 (see the start of Figure 1), which was interrupted by the onset of the crisis in May 2008, when the month-on-month rate of change for the EU-28’s industrial production index turned negative, while the index for domestic output prices peaked two months later in July 2008. The rapid fall in industrial output lasted one year, returning to a positive rate of change in May 2009, while domestic output prices reached their lowest level in July 2009 and started a run of relatively sustained increases from October 2009.
The decline in industrial output in the EU-28 from its relative peak in April 2008 was particularly steep (-19.5 %), as the relative trough recorded in April 2009 was the lowest level of output since September 1997. By contrast, although industrial output prices in July 2009 were 7.6 % lower than at their relative peak a year earlier, they remained in line with the price levels recorded between October and November 2007 prior to the financial and economic crisis; in part, price developments continued to reflect the relatively high price of crude oil and associated energy-related and intermediate products.
Incomplete recovery and subsequent inconsistent developments
Industrial output in the EU-28 recovered during a period of slightly more than two years from its relative low in April 2009, recording positive month-on-month rates of change for 19 out of 25 months through to a peak in May 2011: this peak was 13.8 % above the April 2009 low but nevertheless 8.4 % below the pre-crisis peak of April 2008. Thereafter, there was a gradual decline in EU-28 industrial output observed through until November 2012 during which time output contracted by 4.7 %; subsequently industrial output grew at a relatively slow pace to April 2014, after which there was a mixed pattern of development through to August 2014 (the latest data available at the time of writing).
By contrast, the return to positive rates of change for EU-28 industrial output prices in August 2009 heralded a more sustained and longer period of price growth. The industrial output price index passed its pre-crisis peak in February 2011 and continued an almost unbroken climb until April 2012 when it stood some 13.5 % above the low recorded during the crisis and 4.9 % above the pre-crisis peak (nearly four years earlier). From April 2012 onwards, the development of industrial output prices in the EU-28 followed an irregular pattern with almost no overall change in prices through to the autumn of 2013. Thereafter, industrial output prices fell at a relatively modest pace during a period of almost one year to August 2014 (the latest data available at the time of writing).

Recent developments in the EU Member States and various industrial activities
The recovery in industrial activity across the EU from mid-2009 onwards was less widespread and regular than had been the preceding downturn. Whereas every EU Member State recorded lower output in 2009 than in 2008, three Member States — Greece, Croatia and Cyprus — recorded further reductions in 2010 while all of the remaining Member States recorded an increase. In 2011, the same three Member States again recorded a fall in their industrial output and they were joined by Ireland, Spain, Malta, the Netherlands, Portugal and the United Kingdom. By 2012, most of the EU-28 Member States reported a negative rate of change for industrial output, the exceptions being the three Baltic Member States, Poland, Romania and Slovakia (see Table 1), while the situation in Malta reversed, as it too recorded an increase in industrial activity.