


Eurostat Statistics Explained: Services statistics – short-term indicators, 26 Νοεμβρίου.
This article examines recent statistics in relation to developments for service activities in the European Union (EU). Short-term business statistics (STS) are provided in the form of indices that allow the rapid assessment of the economic climate within services, providing a first assessment of recent developments for a range of activities.
Traditionally, short-term business statistics were concentrated on industrial and construction activities, and to a lesser extent retail trade. Since the middle of the 1990s, major developments in official statistics within the EU have seen short-term data collection efforts focus increasingly on services.

MAIN STATISTICAL FINDINGS
Turnover: impact of the financial and economic crisis and partial recovery
Services turnover fell by 10.1 % in the EU-28 in 2009 compared with the year before, but rebounded in 2010 and 2011 increasing by 5.4 % and 5.6 % respectively. Growth continued in 2012 and 2013, but at a more modest pace (rising by 0.3 % and 1.0 %).
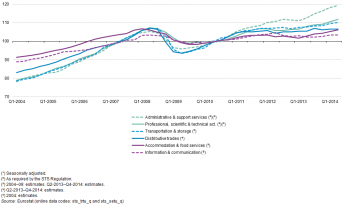
Having peaked in various quarters of 2008, EU-28 turnover for all six of the services shown in Figure 1 reached a low point in the second or third quarter of 2009, or the first quarter of 2010. From these lows, the strongest growth in turnover across the different services through to the second quarter of 2014 was recorded for administrative and support services (24.4 %), followed by transportation and storage services (17.8 %). Distributive trades as well as professional, scientific and technical activities also recorded double-digit growth between their mid-crisis lows and their latest levels (second quarter of 2014), with turnover rising by 13.9 % and 13.3 % respectively. The rates of change for the other services were more modest: compared with the most recent low points at the height of the crisis, EU-28 turnover in the second quarter of 2014 was 8.1 % higher for accommodation and food services and 4.4 % higher for information and communication services.
Despite the recent growth recorded for all six of these services activities, as can be seen from Figure 1, the losses in turnover resulting from the financial and economic crisis were more quickly recovered for some services in the EU-28 than for others. EU-28 turnover indices for administrative and support services, transportation and storage services and information and communication services rebounded to their pre-crisis levels during 2011; for professional, scientific and technical activities the pre-crisis peak was passed in the second quarter of 2013. By contrast, the latest turnover indices (second quarter of 2014) for distributive trades and for accommodation and food services remained, in the second quarter of 2014, marginally below their respective levels recorded prior to the crisis.
Latest annual turnover developments
Among service activities (at the NACE Rev. 2 section level), the fastest rates of turnover growth in 2013 in the EU-28 were recorded for business-oriented services and for distributive trades: turnover for administrative and support services grew by 2.4 %, that for distributive trades by 2.0 %, and sales of professional, scientific and technical activities increased by 1.9 %. There was slower growth recorded for transportation and storage activities (0.8 %) and for accommodation and food services (0.6 %), while the only services NACE section in the EU-28 to see a fall in turnover in 2013 was information and communication services (-1.0 %).
The developments for services turnover in 2013 varied greatly among the EU-28 Member States. Greece (-8.5 %) and Cyprus (-9.0 %) reported substantial falls in services turnover compared with 2012, while there was a decline in sales in 12 other EU Member States (including France, Germany, Spain and Italy). By contrast, the highest growth was recorded for Estonia (10.2 %), while turnover rose by 5 %–10 % in Slovakia, Lithuania, the United Kingdom and Hungary.
Table 1 provides an analysis of the two latest rates of change for turnover for each of the services sections covered by short-term business statistics. Growth rates in excess of 15 % were recorded in 2013 for: distributive trades in Estonia; accommodation and food services in Croatia (during the year it became a member of the EU); information and communication services in Hungary; professional, scientific and technical activities in Slovakia; and administrative and supporting activities in Ireland, Hungary and Slovakia. There were positive rates of change for the growth of turnover for all six services in Lithuania, Luxembourg, Hungary, Poland, Romania, Slovakia and the United Kingdom. By contrast, turnover fell for all six of these services in Cyprus in 2013, while the level of sales fell for five out of the six services in Greece, Spain, Italy and Portugal.
Volume of retail sales
While turnover shows sales in current prices, the volume of sales indicates the situation once price changes have been removed. Between 2008 and 2013 the volume of sales in retail trade for the EU-28 fell every year, except for 2010, when growth of 0.3 % was recorded — see Table 2. A monthly series (see Figure 2) shows that the EU-28’s volume of retail sales peaked in February 2008 and fell by a total of 4.4 % through to March 2009. The volume of retail sales remained relatively stable between March 2009 and March 2012 and then declined to a new low in April 2013. The latest developments show an increase in the volume of sales between April 2013 and August 2014 (the latest period for which data are available at the time of writing)…
…