Eurostat Statistics Explained: Intra-EU trade in goods – recent trends, 08 Δεκεμβρίου.
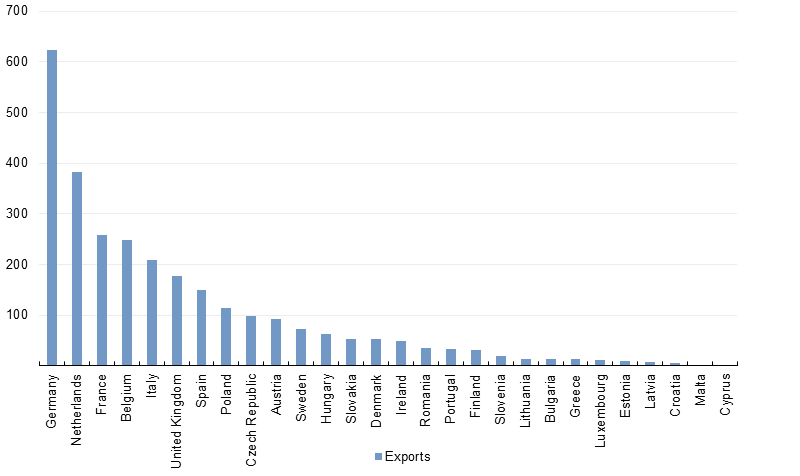
This article takes a close look at recent trends, focusing on total intra-EU trade in goods and the most traded products. It presents statistics for the EU-28 aggregate and for individual Member States for the period covering 2002 to 2013, although the composition of the actual EU has changed over this period.
Statistics on international trade in goods between Member States of the European Union (EU)– especially the size and evolution of imports and exports – enable the EU and national authorities to evaluate the growth of the Single Market and the integration of EU economies. These statistics also provide EU businesses with essential information for their sales and marketing policies.
Main statistical findings
Figure 1 shows the seasonally adjusted value of monthly total exports of goods for EU-28 Member States to other Member States. In 2002 and 2003 the level of exports of goods was fairly stable, followed by a period of rapid increase between 2004 and the third quarter of 2008. From the fourth quarter of 2008 to the end of the second quarter of 2009 there was a sharp decrease in the value of exports of goods. Following this decline the value of exports of goods began to increase again until the beginning of 2011, when it had returned to the level seen before the decrease at the end of 2008. From 2011 onwards the level has been relatively stable and the seasonally adjusted annual value for 2013 is over EUR 3 300 billion.
Since the introduction of the Intrastat data collection system for intra-EU trade in goods on 1 January 1993, the value of intra-EU exports of goods has been consistently higher than that of intra-EU imports of goods. In theory, as intra-EU exports of goods are declared FOB-type value and intra-EU imports of goods CIF-type value, the value of intra-EU imports of goods should be slightly higher than that of intra-EU exports of goods. The analysis presented in this article considers intra-EU exports of goods only, as it is the more reliable measure of total intra-EU trade in goods since, at aggregated levels, total intra-EU exports of goods has better coverage than total intra-EU imports of goods.
In 2013 just over 62 % of the total value of goods (intra-EU and extra-EU trade combined) exported from EU Member States were to other Member States. This proportion has declined since 2002 by just over 6 percentage points, falling gradually since 2008.


