


Mitchell, B. (2015) “Friday lay day – more snake oil from Brussels“, Bill Mitchell Blog, 16 Ιανουαρίου.
It’s my Friday lay day blog. I am in Sri Lanka at present and will have some reports about that over the next 14 odd days. I was amazed overnight by the comments from IMF boss Lagarde who made overt political statements in an upcoming election year by claiming that David Cameron had shown “eloquent and convincing” leadership in the global recovery. She said they were a model for the European Union. When asked why the IMF had criticised Britain in 2012 for “playing with fire” by invoking fiscal austerity, she said the IMF had “got it wrong” (Source). Hmm. No recognition that Britain cannot be a model for most of the EU nations, given the latter surrendered their currency sovereignty, imposed fiscal rules that prevent growth, and have a central bank that will not act as a responsible currency issuer. Further, it was a false admission of failure. In fact, the IMF got it right and Britain didn’t implement the austerity that it had initially planned and has kept a relative large fiscal deficit that has helped support growth.
But I wanted to comment today on a throwaway line on Page 32 of the recently released – EU Employment and Social Situation, December 2014 – (5.9 mb), which said the following:
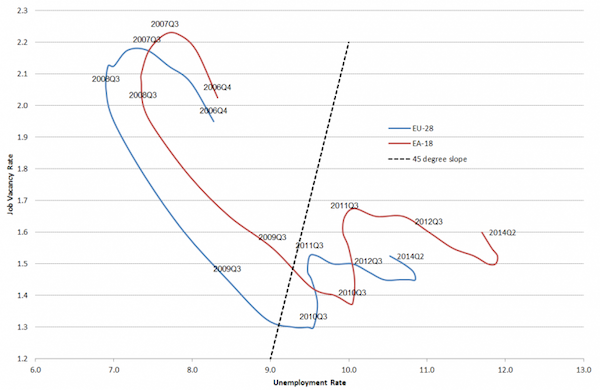
The upward shift in the EU Beveridge curve, which has occurred in the EU since 2008 (with a higher indicator for labour shortage for a given unemployment rate) suggests increasing mismatches in the EU labour markets. Recent data suggest both positive and negative developments in relation to the labour market matching process in the EU. The recent developments of lower unemployment and higher labour shortage are equivalent to the usual move along the Beveridge curve and confirm the recent improvements in the job vacancy rate. At the same time and up to the start of 2010, the Beveridge curve has shifted upwards relative to its general position, suggesting a structurally worse matching process in the EU (Chart 39).
The Chart 39 in question is reproduced here, although I use the data available in the special Eurostat page – Job vacancy and unemployment rates – Beveridge curve.
The EU’s explanation of the recent data observations as shifts in the curve run along the conventional lines, which lead to the claims that the mass unemployment is structural in cause and therefore needs a different policy solution – not an increase in aggregate demand but more training, income support cuts etc.
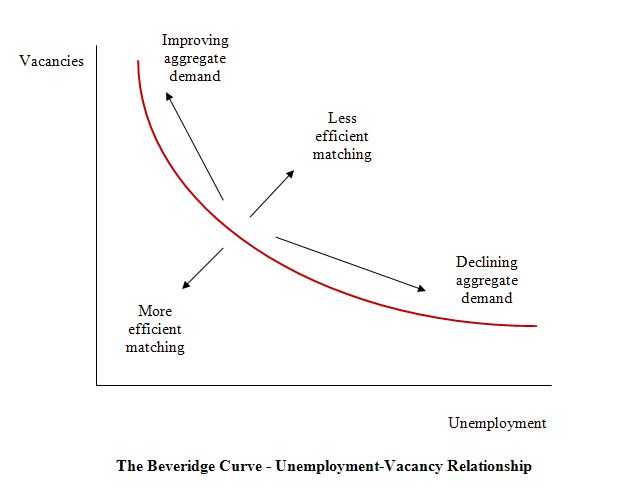
Economists have long used the unemployment-vacancy (UV) relationship, the so-called Beveridge curve, which plots the unemployment rate on the horizontal axis and the vacancy rate on the vertical axis to investigate these sorts of questions.
The Beveridge curve is named after the British economist William Beveridge who was influential in defining the full employment agenda in the Post World War 2 period in the UK (and, arguably in most advanced nations).
The following diagram is the usual depiction of the UV relationship with vacancies on the vertical axis and unemployment on the horizontal axis. The red line is a UV curve at some point in time.
Σχετικές αναρτήσεις:
- Katz, F. L., Kroft, K., Lange, F. & Notowidigdo, M. (2014) “Addressing long-term unemployment in the aftermath of the Great Recession“, VoxEU Organisation, 03 Δεκεμβρίου.
- Andor, L. (2014) “Re-discovering the Phillips curve“, VoxEU Organisation, 01 Οκτωβρίου.
- Algan, Y., Cahuc, P. & Sangnier, M. (2014) “Trust and the welfare state: The twin-peaked curve“, VoxEU Organisation, 17 Ιουλίου.